Table of contents
Debugging
Debugging code is an essential skill and thought process. It involves identifying and fixing errors, bugs and unexpected behaviour in code. There are many reasons and ways to debug code, we will mainly focus on using debuggers. Some people like to put print statements in their code to debug, which works to a certain extent. Ideally you should use some form of unit tests as an indicator for incorrect behaviour in your code. Each unit test tests the correctness of a small piece of your code. Once the incorrect behaviour has been identified, you can start using a debugger to figure out why it is occuring. Another more obvious indicator that you should debug your program is if it crashes, obviously!
Debugging in RARS:
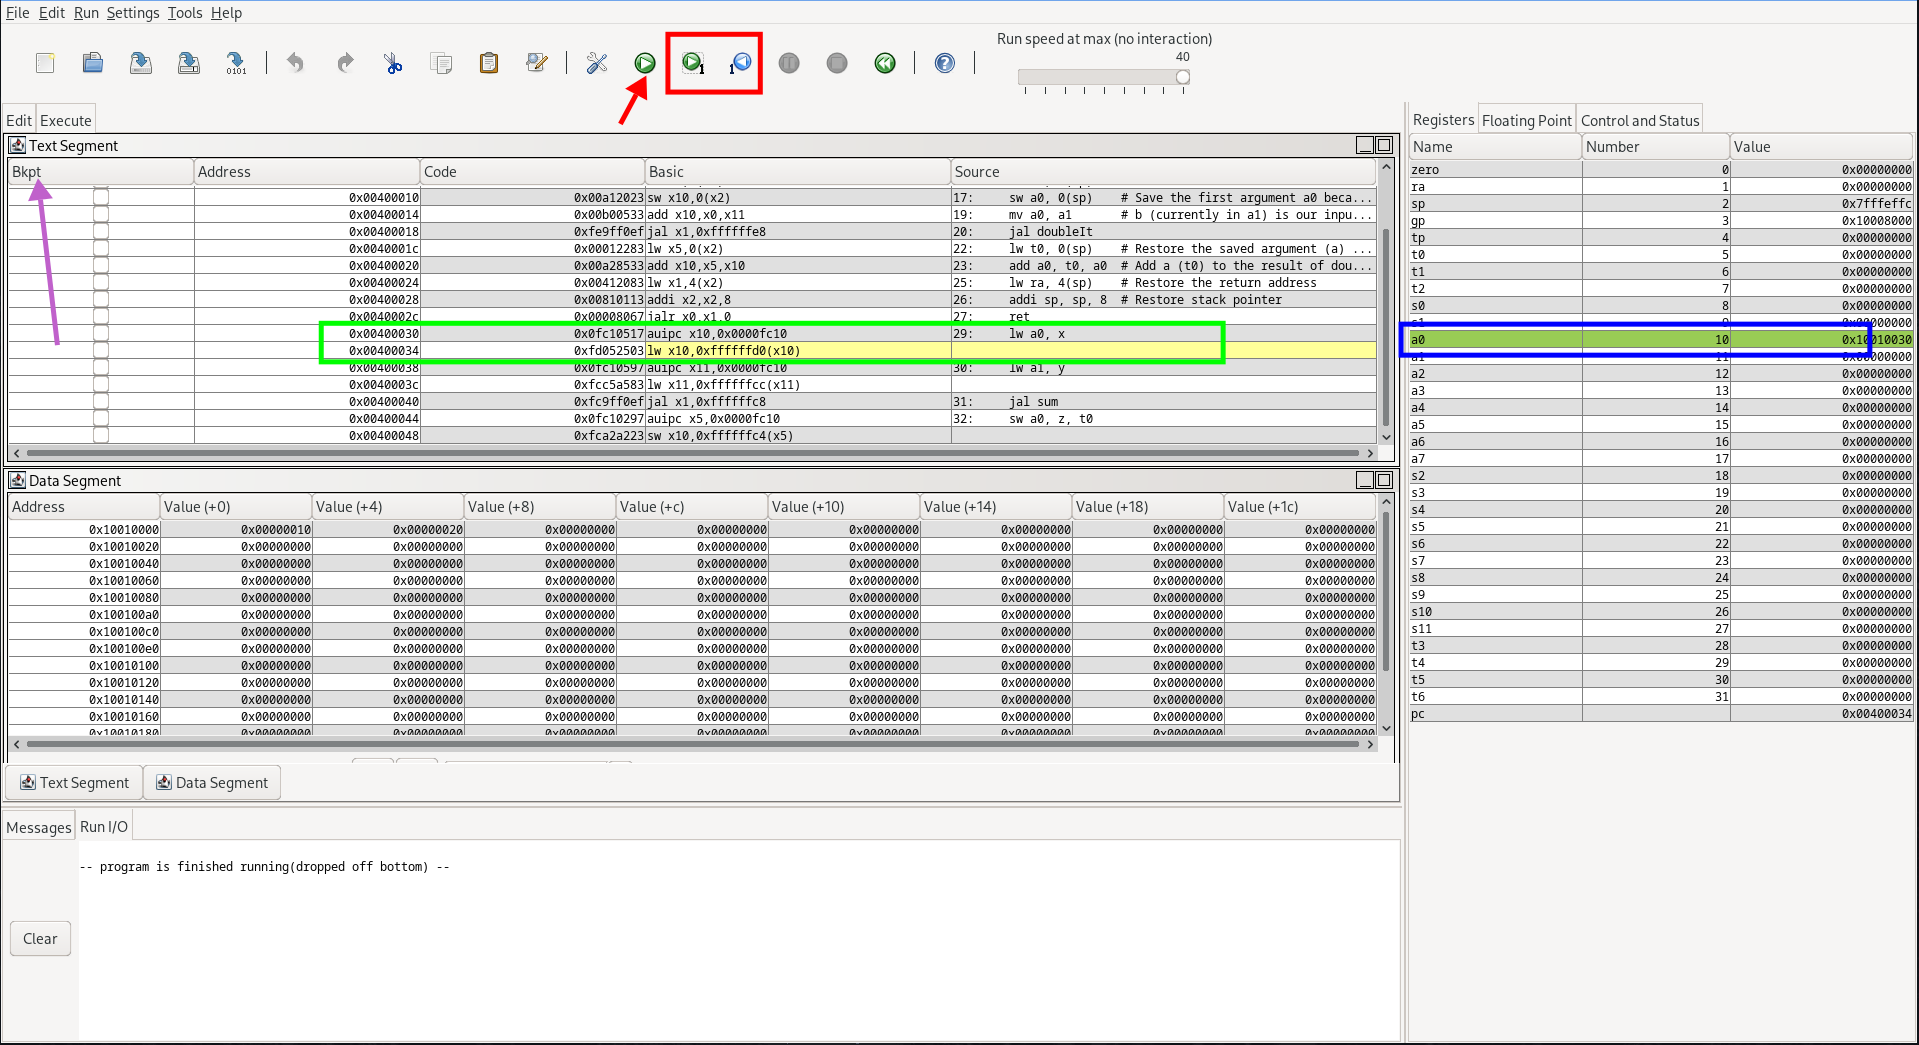
RARS allows you to execute your assembly code step by step, see the red rectangle for the controls. You can walk forwards and backwards. Meanwhile, you can also see the current instruction being executed in the green rectangle. In the blue rectangle, you can see the RISC-V registers; the ones that are being changed are indicated with a green background. It is also possible to set a breakpoint (purple arrow) at a certain instruction. This will pause the program when it encounters that specific instruction.
Usually you try to look for the exact location where the execution is going wrong, thus isolating the problem. Then you try to reproduce it consistently and understand why it’s going wrong. Once that step is done you can fix the problem, and afterwards you test to see if the solution is working as intended.
You should also notice in the green square that some instructions we wrote down in our program (source) actually consist of multiple (basic) instructions.
Please bear in mind that debugging is a skill that requires practice to become fluent at. The most effective approach to learning is through hands-on experience. Choose a simple program, meticulously examine it step by step, and try to understand what is happening and why.
There’s also built-in debugging available in RARS (Top bar: Help -> RARS -> Debugging).
Debugging C:
We will not dive too deep into debugging C programs. A useful tip is to use the compiler itself; it will notify you what the error is and where it occurs. This isn’t to say that a succesfully compiled program doesn’t have any bugs! Many bugs can only be found through rigorous testing, for example through unit tests.
A short example:
#include <stdio.h>

int main(void){
    int x;
    printf("Please enter an integer: \n");
    scanf("%d", x);
    printf("The integer you entered is: %d \n", x);
    return 0;
}
If you try to compile this program with the -Werror (treat warnings as errors) and -Wformat (consider format errors) flags,you’ll get an error:
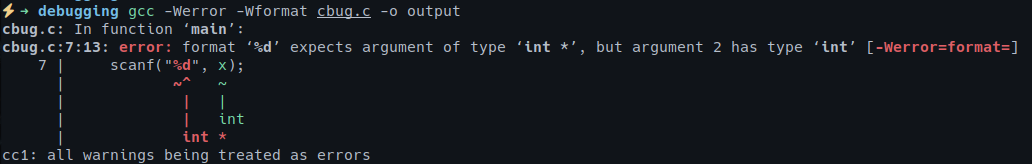
This error boils down to the scanf() function expecting the address of an integer to store the user’s input in. So we need to change that line to scanf("%d", &x);. Notice the &
Extra Resources:
If you want to dive deeper into C debugging, consider looking into GDB, which is a very capable debugger. Here is a short introduction video on the basics of GDB. Please notice that when you compile a C program, you usually compile it to x86-64 assembly, which differs from RISC-V.